WordPress Performance: A Practical Guide to Core Web Vitals
Core Web Vitals are now a Google ranking factor. Here's what they actually measure, why most WordPress sites fail them, and how to fix the ones that matter.
Google made Core Web Vitals a ranking signal in 2021, and the bar has moved upward every year since. Despite that, the majority of WordPress sites still fail at least one of the three metrics — not because the fixes are difficult, but because most performance advice either stops at Lighthouse scores or recommends a plugin without explaining what it’s actually doing.
This guide covers what Core Web Vitals actually measure, why WordPress sites specifically struggle with them, and what to do about it.
What Core Web Vitals measure
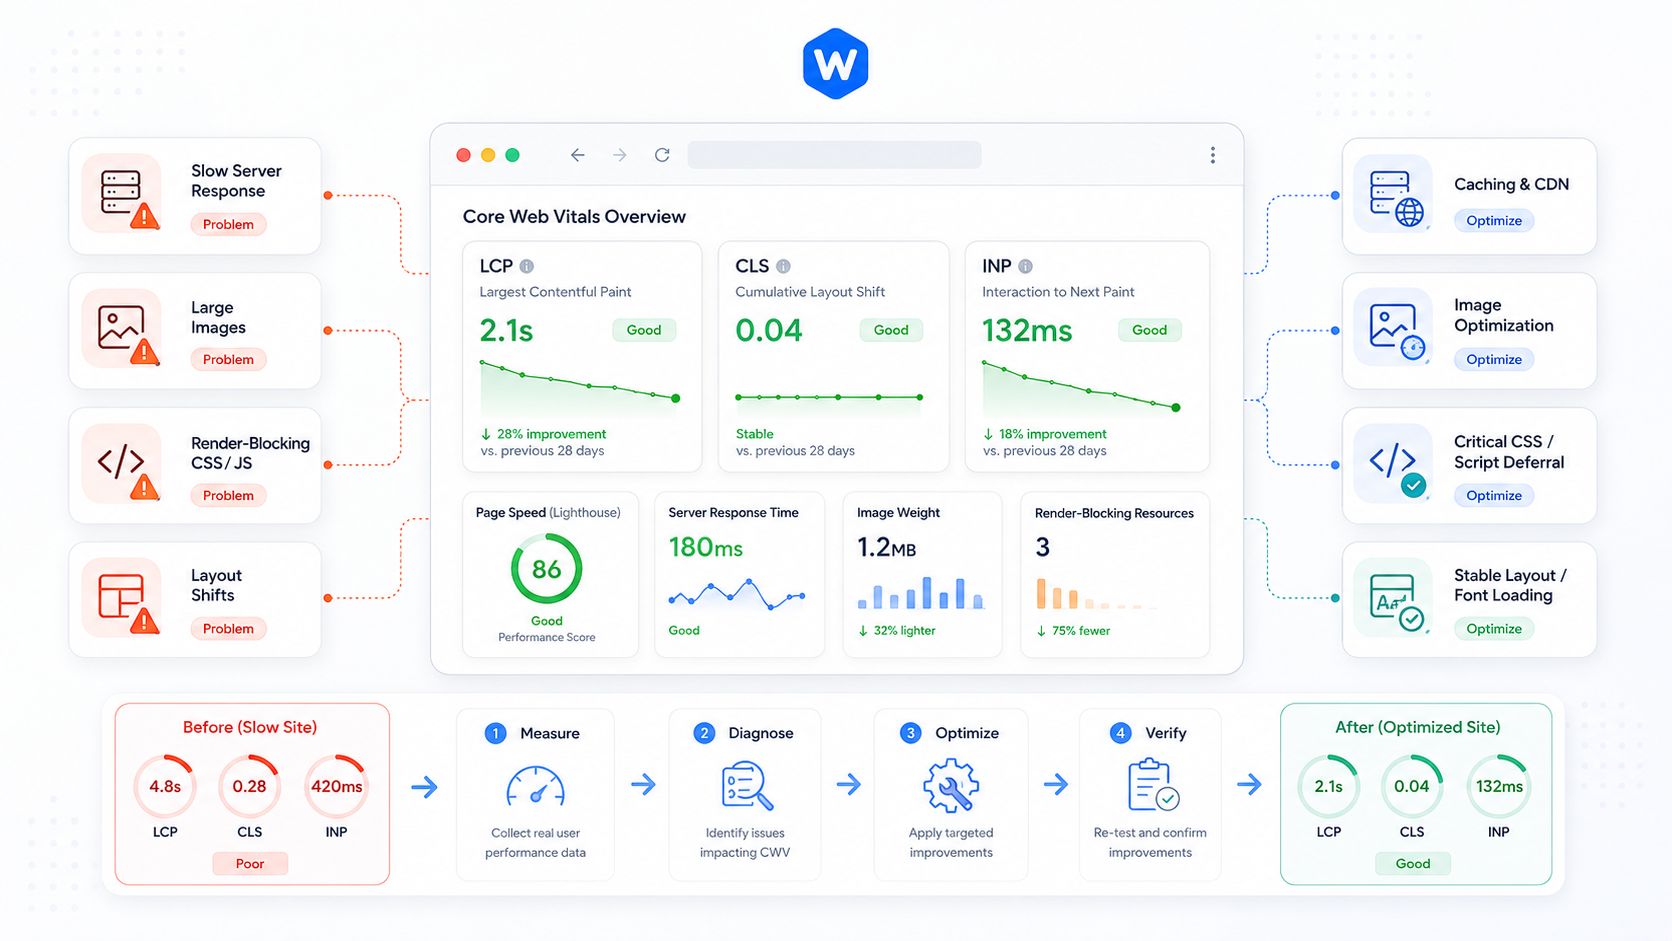
There are three metrics, and they measure different things:
Largest Contentful Paint (LCP) — How long until the largest visible element on the page is rendered. For most sites this is a hero image, a heading, or a large block of text. Google’s threshold: under 2.5 seconds is “good,” 2.5–4 seconds needs improvement, over 4 seconds is poor.
Cumulative Layout Shift (CLS) — How much the page visually shifts around while loading. You know this feeling: you go to click a button and it moves just before your finger lands. Google’s threshold: under 0.1 is good.
Interaction to Next Paint (INP) — How quickly the page responds to user input. Replaced First Input Delay (FID) in March 2024. Google’s threshold: under 200ms is good.
LCP is where most WordPress sites have the most room to improve.
Why WordPress sites struggle
WordPress’s flexibility is also its performance liability. A typical WordPress site accumulates:
- A theme that loads its entire CSS file on every page regardless of what’s used
- A dozen plugins, each loading their own JavaScript and CSS on the frontend
- Images uploaded at full resolution with no optimization pipeline
- No caching configuration, or caching configured incorrectly
- Render-blocking scripts loaded in the document
<head>
None of these are fundamental WordPress problems — they’re the result of how WordPress sites are typically built and maintained.
Fixing LCP
LCP is almost always caused by one of three things: a slow server, a large unoptimized image, or render-blocking resources delaying when the browser can start rendering.
Server response time
Before any frontend optimization matters, your server needs to respond quickly. For WordPress this means:
- PHP 8.x (8.1+ is meaningfully faster than 7.4)
- OPcache enabled and configured with enough memory
- Object caching (Redis or Memcached) to reduce database queries
- Full-page caching for anonymous traffic
A WordPress page that hits the database on every request will be slow regardless of what you do to the HTML and assets.
Image optimization
The LCP element is most commonly a hero image. For that image specifically:
- Serve it at the correct size for the viewport — don’t load a 2400px image for a 1200px container
- Use WebP format with a JPEG/PNG fallback
- Add
fetchpriority="high"to the LCP image so the browser prioritizes its download - Do not lazy-load the LCP image — lazy loading and
fetchpriority="high"are contradictory instructions
For the rest of your images, lazy loading is correct: loading="lazy" on everything below the fold.
Render-blocking resources
The browser can’t start rendering until it’s finished parsing CSS and any synchronous JavaScript in the <head>. Common culprits:
- Google Fonts loaded via a standard
<link>in the head — usefont-display: swapand preconnect tofonts.googleapis.comandfonts.gstatic.com - Plugin scripts loaded synchronously — most can be deferred with the
deferattribute or moved to load after the document - Unused CSS from your theme or page builder — a page builder generating 500KB of CSS for a page that uses 20KB of it is a real problem
Fixing CLS
Layout shift is caused by elements that change size or position after the initial render. The most common sources in WordPress:
Images without explicit dimensions — If your <img> tag doesn’t have width and height attributes, the browser doesn’t know how much space to reserve and the layout shifts when the image loads. WordPress has set these attributes automatically since version 5.5, but older themes and custom image code often don’t.
Web fonts — When a font loads and swaps in, it can cause text to reflow. Use font-display: swap and preload your primary web font.
Late-loading ads or embeds — Ad networks and social embeds that inject content after the page has rendered are a major CLS contributor. Reserve space for them explicitly.
Dynamically injected content — Cookie banners, chat widgets, and notification bars that slide in and push content down are a CLS source. Load them in reserved space rather than injecting them after render.
Fixing INP
INP measures how fast the page responds to clicks, taps, and keyboard input. Poor INP is almost always caused by JavaScript blocking the main thread.
The usual suspects on WordPress sites:
- Page builders that ship large JavaScript bundles to the frontend even when the page doesn’t use interactive features
- Analytics and tag manager setups that accumulate years of tags without cleanup
- Sliders and carousels that run continuous JavaScript animations
The fix is generally identifying which scripts are causing long tasks (Chrome DevTools’ Performance panel shows this), then either deferring them, loading them lazily on interaction, or replacing them with lighter alternatives.
What not to do
Don’t optimize only for Lighthouse scores — Lighthouse runs in a throttled lab environment. A 95 Lighthouse score can coexist with real-user performance problems. Use Chrome User Experience Report (CrUX) data in Google Search Console to see how your site actually performs for real visitors.
Don’t install a caching plugin and assume you’re done — Caching helps with server response time and LCP, but it doesn’t address CLS, INP, or render-blocking resources. It’s one piece, not a complete solution.
Don’t compress images without checking the LCP element — Aggressive compression on your LCP image can hurt visual quality at the moment that matters most. Optimize for format and dimensions before aggressively reducing quality.
A practical starting point
If you’re not sure where to start:
- Run your site through Google Search Console’s Core Web Vitals report to see real-user data
- Open Chrome DevTools and run a Lighthouse audit to identify the biggest opportunities
- Check your LCP element — is it an image? Is it the right size? Does it have
fetchpriority="high"? - Check your server stack — are you running a caching layer? Object caching?
- Audit your installed plugins — remove anything you’re not actively using
That process will surface the issues worth fixing on your specific site, rather than running a generic optimization checklist.